Detail Confidence Factor
Confidence Factor
Data mining tool to identify false alarms and false passes
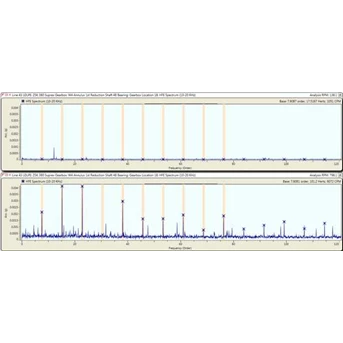
Upper chart: Confidence near 0% Lower Chart: Confidence near 100%
Specific faults have a known signature. For example, a bearing inner race fault will produce a set of spectral peaks at known frequencies. The development of Spectral Band Analysis was a tremendous improvement compared to simple overall readings, since the amplitude of the individual frequencies ( that corresponded to specific faults) were trended. However, these measurements were still vulnerable to false alarms since an increase in the background noise or an interfering peak would cause a trend to rise and a resulting false alarm. This condition is called Band Contamination. Another failure of Spectral Band Analysis occurs if an alarm threshold is set too high. A developing fault may then be missed. This condition is called a False Pass.
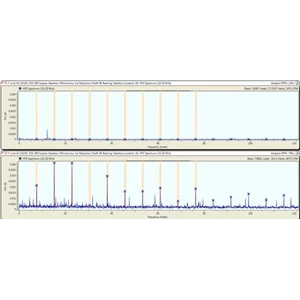
Espresso features an innovative technique called Confidence Factor ( patent pending) . This technique utilizes the powerful new Espresso processing platform to perform a Signature Index on each analysis. A Signature Index is a pattern recognition technique that quantifies the similarity of the measured peaks to the expected fault peak frequencies and pattern. The Signature Index provides a strong indication of whether a measurement actually represents a real fault or damage. If the Signature Index is low, it most likely means that the specific fault is not present, but if the Signature Index is high, then it is a safe bet that the fault indicated is real. The results of the banding calculation and the Signature Index are graphed in a Confidence Factor plot.
The plot is a data mining tool to identify false alarms and false passes. The normalized band amplitude is plotted vertically and the Signature Index horizontally. The plot is populated with a collection of amplitude/ index pairs. This plot quickly shows if a significant signature is present and if the amplitude is larger than normal, indicating that a component fault is developing. A typical trajectory of a developing fault begins in the lower left quadrant in the no defect region, moves right as the signature grows through the early fault region, and then moves up as the fault progresses in severity.
Informasi lebih lanjut hubungi kontak dibawah ini:
Office : Jl.Radin Inten II No 61 B Duren Sawit Jakarta Timur
Phone : 021-29563051 ( hunting)
Hp : 08156141954
Fax : 021-29563052
Pin BB : 284152F7
Email : sales@ Vibrasindo.com
Website : www.vibrasindo.com
Tampilkan Lebih Banyak